 History is poised to repeat itself in the stock market, and the result won’t be pretty for the bulls. Last week we noticed a pattern in the PowerShares QQQ Trust(QQQ) that is eerily similar to one that occurred late last year and preceded the stock market’s worst January ever.
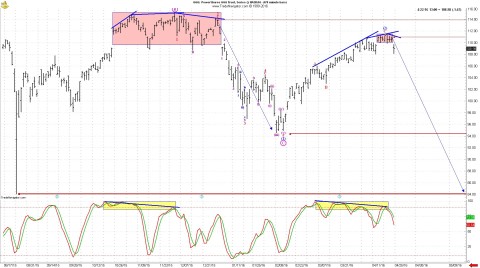
This pattern is called a ‘gap island reversal,’ and it marks the end of a previous trend and the beginning of a new one. Look at the intraday bar chart below of the PowerShares QQQ Trust, the exchange-traded fund that tracks the Nasdaq 100 index. Notice the large pink box at the top of the graph? It’s not attached to the price bars to its left or to those to its right. This ‘island’ of price behavior began with a gap higher on Oct. 23 and ended with a gap lower on Jan. 4. This formation shows exhaustion, and in this particular case, it revealed exhaustion of the final rise off the August panic spike reversal.
Now look at last week’s activity. Although last week’s high came within a few cents of the Dec. 31 low, it failed to fill the gap to that low. This is an ‘uh oh’ moment, when the crowd realizes it’s been trapped into late-joining buying, mostly because of the gap that began the island formation.
This post was published at David Stockmans Contra Corner on May 2, 2016.

Recent Comments